Make smarter and data-driven financial decisions
Optimize your vacation rental or independent hotel business, uncover growth opportunities, and execute with confidence using expert finance and data analytics guidance from experienced hospitality professionals.
We are a strategic finance and data analytics partner for vacation rental operators and independent hotels.
Who we are
We turn complexity into clarity and insight into action. By combining senior-level finance leadership with data-driven analysis, we help organizations improve profitability, sharpen decision-making, and move forward with confidence.
World-class Strategic Finance and Data Analytics
Budgeting
•
Forecasting
•
Investor and Board Reporting
•
Plan vs. Actual Scorecards
•
KPIs Reports
•
LTV & CAC Analysis
•
Financial Health Monitoring
•
Pricing
•
Cash Flow Management
•
Budgeting • Forecasting • Investor and Board Reporting • Plan vs. Actual Scorecards • KPIs Reports • LTV & CAC Analysis • Financial Health Monitoring • Pricing • Cash Flow Management •
Who we work with
We support operators across North America, from small portfolios to large, multi-market operations.

Short-term rental managers

Independent hotel brands
As portfolios scale, financial visibility becomes harder, and decisions carry more risk. We help operators navigate seasonality, revenue and cost dynamics, and margin pressure by bringing clarity to the numbers and focus to the decisions that matter most.

What we offer
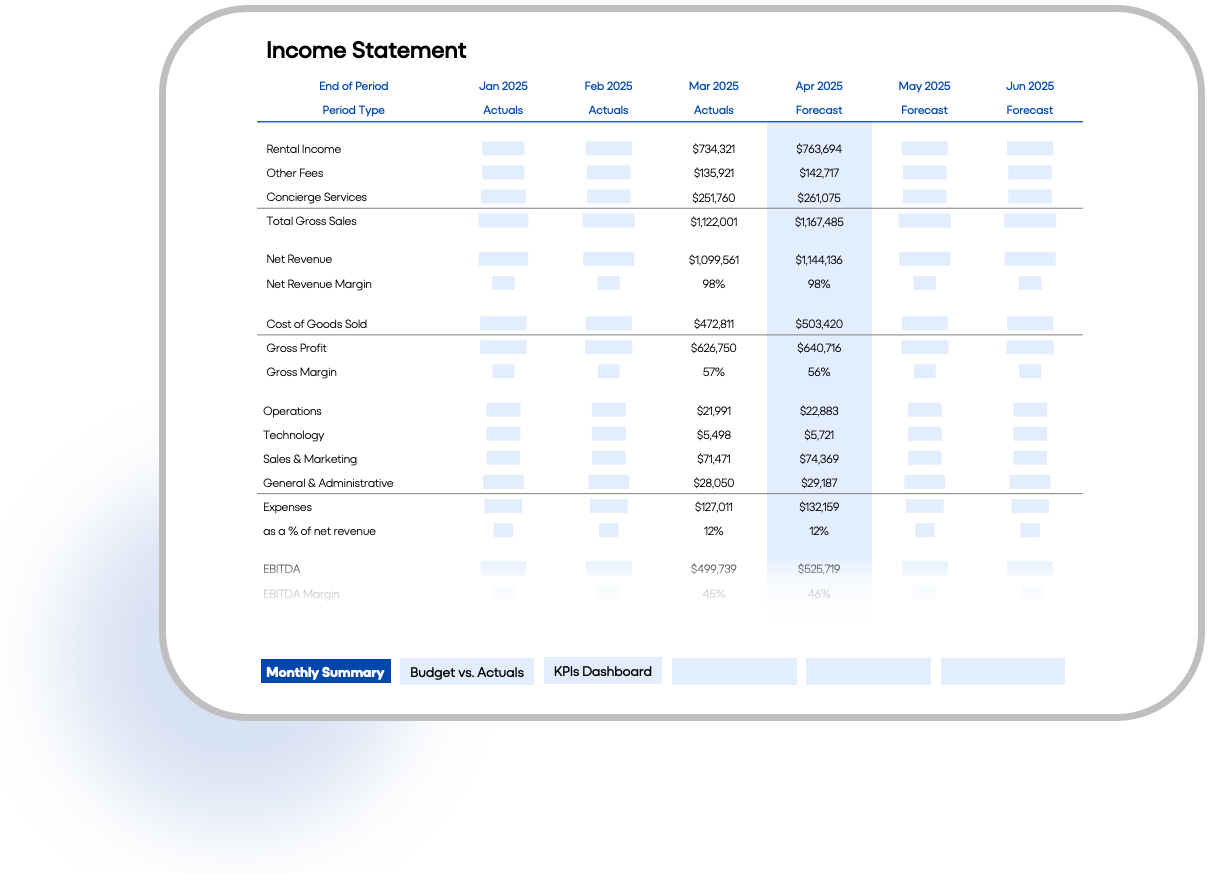
Financial Planning and Clarity
Forecasting, budgeting, and reporting designed for STR managers and independent hotels, giving you confidence in your numbers and visibility into performance.

Market & Unit Economics Insight
We analyze performance at the property, market, and portfolio level to identify margin pressure, cost leakage, and underperforming areas by combining internal data with market benchmarking.

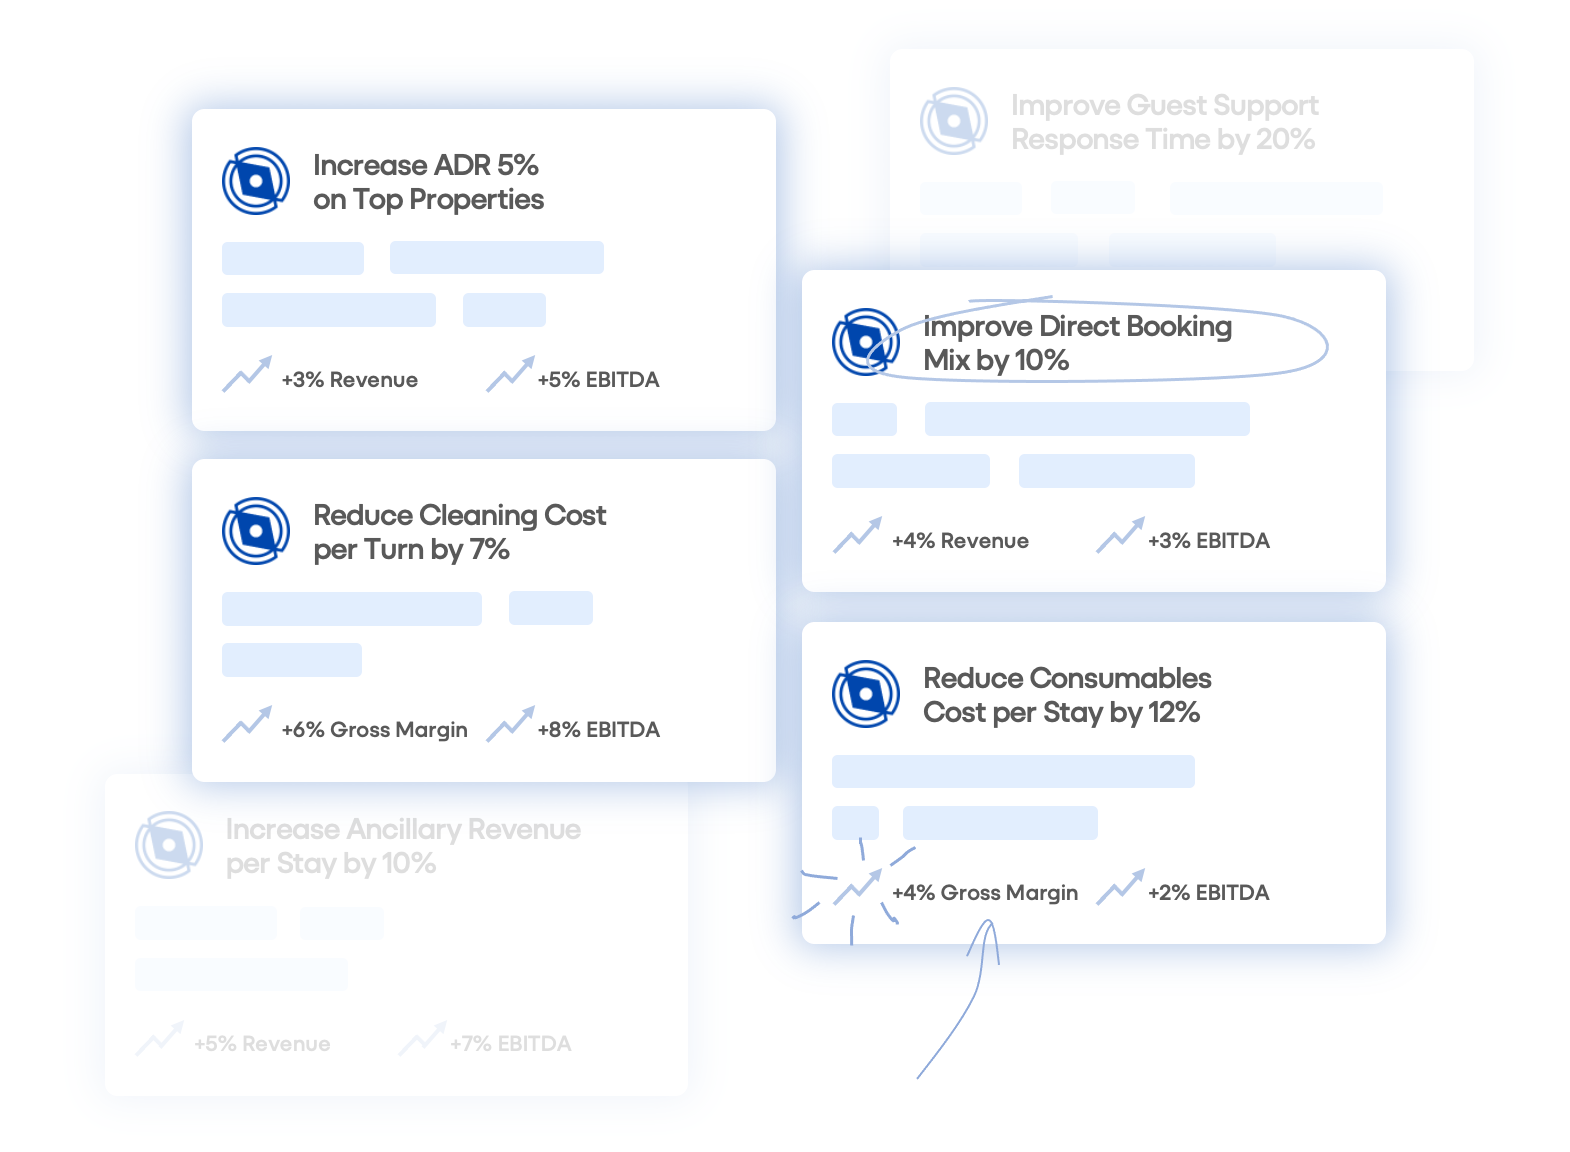
Strategic Finance & Growth Decisions
We support high-impact decisions with scenario modeling, financial analysis, whether evaluating growth, pricing changes, fundraising, or acquisitions.
Scalable Finance Infrastructure
We help build finance and data foundations that scale as your operation grows. From general ledger and reporting structure optimization to ERP and operational system support.
Start with a Free Assessment
Book a free initial assessment. We’ll analyze your business, surface the most impactful opportunities across performance, margins, and data, and help you walk away with clarity on where to focus first.